
How it started
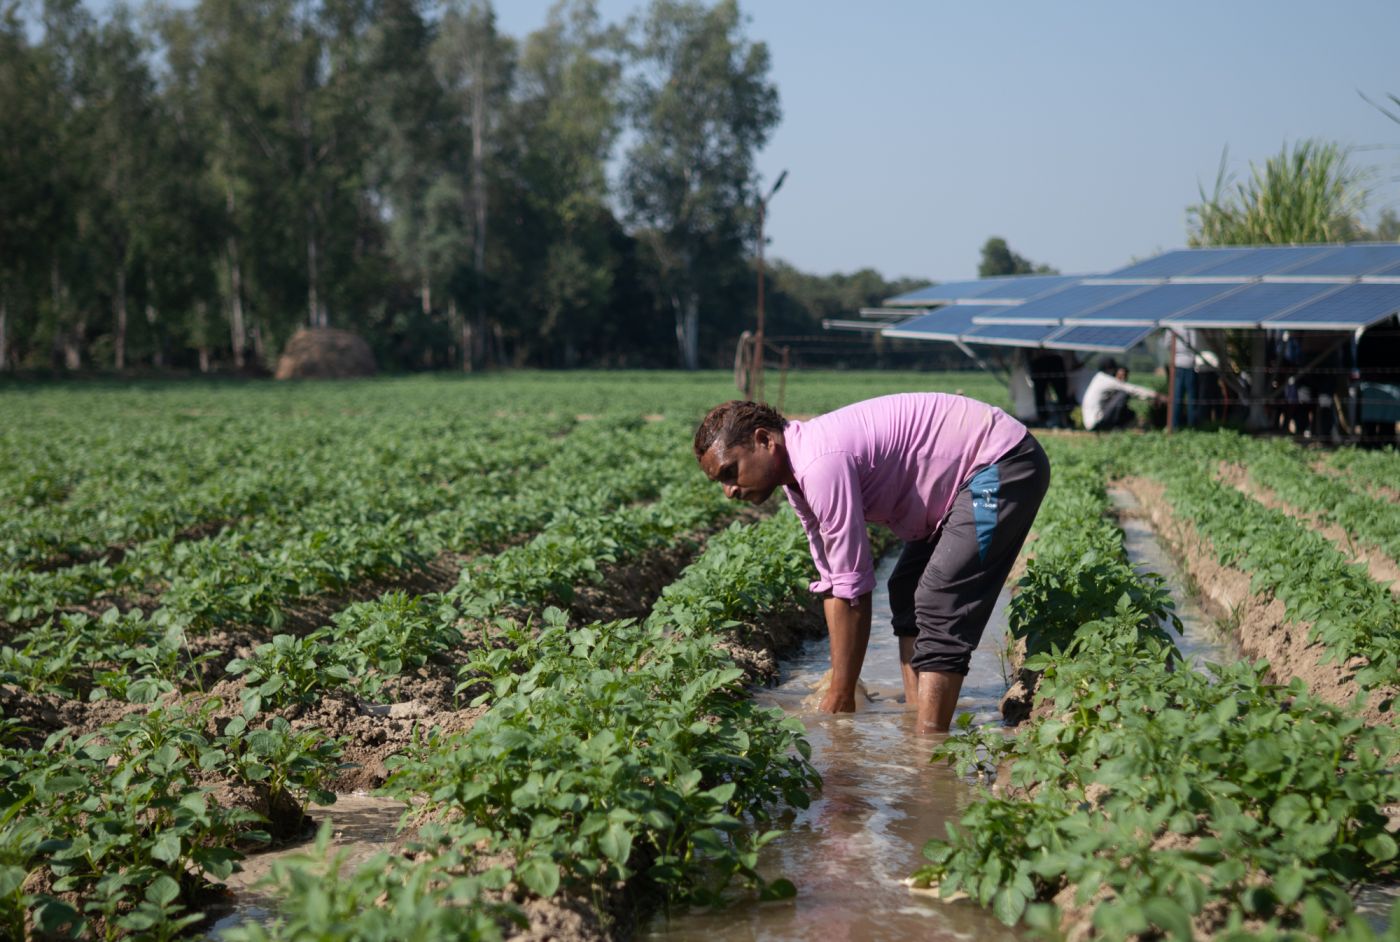
In India’s Uttar Pradesh state, where agriculture sustains most rural families, smallholder farmers long relied on diesel-powered motor pumps to irrigate their fields. Each hour of pumping costs between ₹130 and ₹200, and the time it would take was unpredictable. This recurring expense ate into already modest farm incomes, especially when diesel prices rose or fuel was scarce.
This unsustainable cycle inspired the creation of Oorja, a social enterprise working to make irrigation and other clean energy services affordable, reliable, and sustainable for smallholder farmers.
From the beginning, founders Amit Saraogi and Dr. Clémentine Chambon were intentional about measuring Oorja’s impact on energy poverty, rural economic development and carbon emissions. They tracked diesel savings, CO₂ reductions, farmers served, pump usage, crop yields, and crop diversification. They also gathered feedback directly from farmers to understand satisfaction and user experience.
“The metrics reflected both what we were interested in measuring as a company, but also what our early grant funders were interested in knowing,” says Dr. Clémentine.
From these early efforts, Oorja’s impact model took shape.
Oorja began measuring impact from day one, and that early discipline shaped the way their entire model evolved. Even simple metrics helped them understand what mattered and refine their core offering.
Are you tracking the information you need to understand whether your early model is actually working?
What small set of metrics could help you test your assumptions and communicate value more clearly?
How their model works
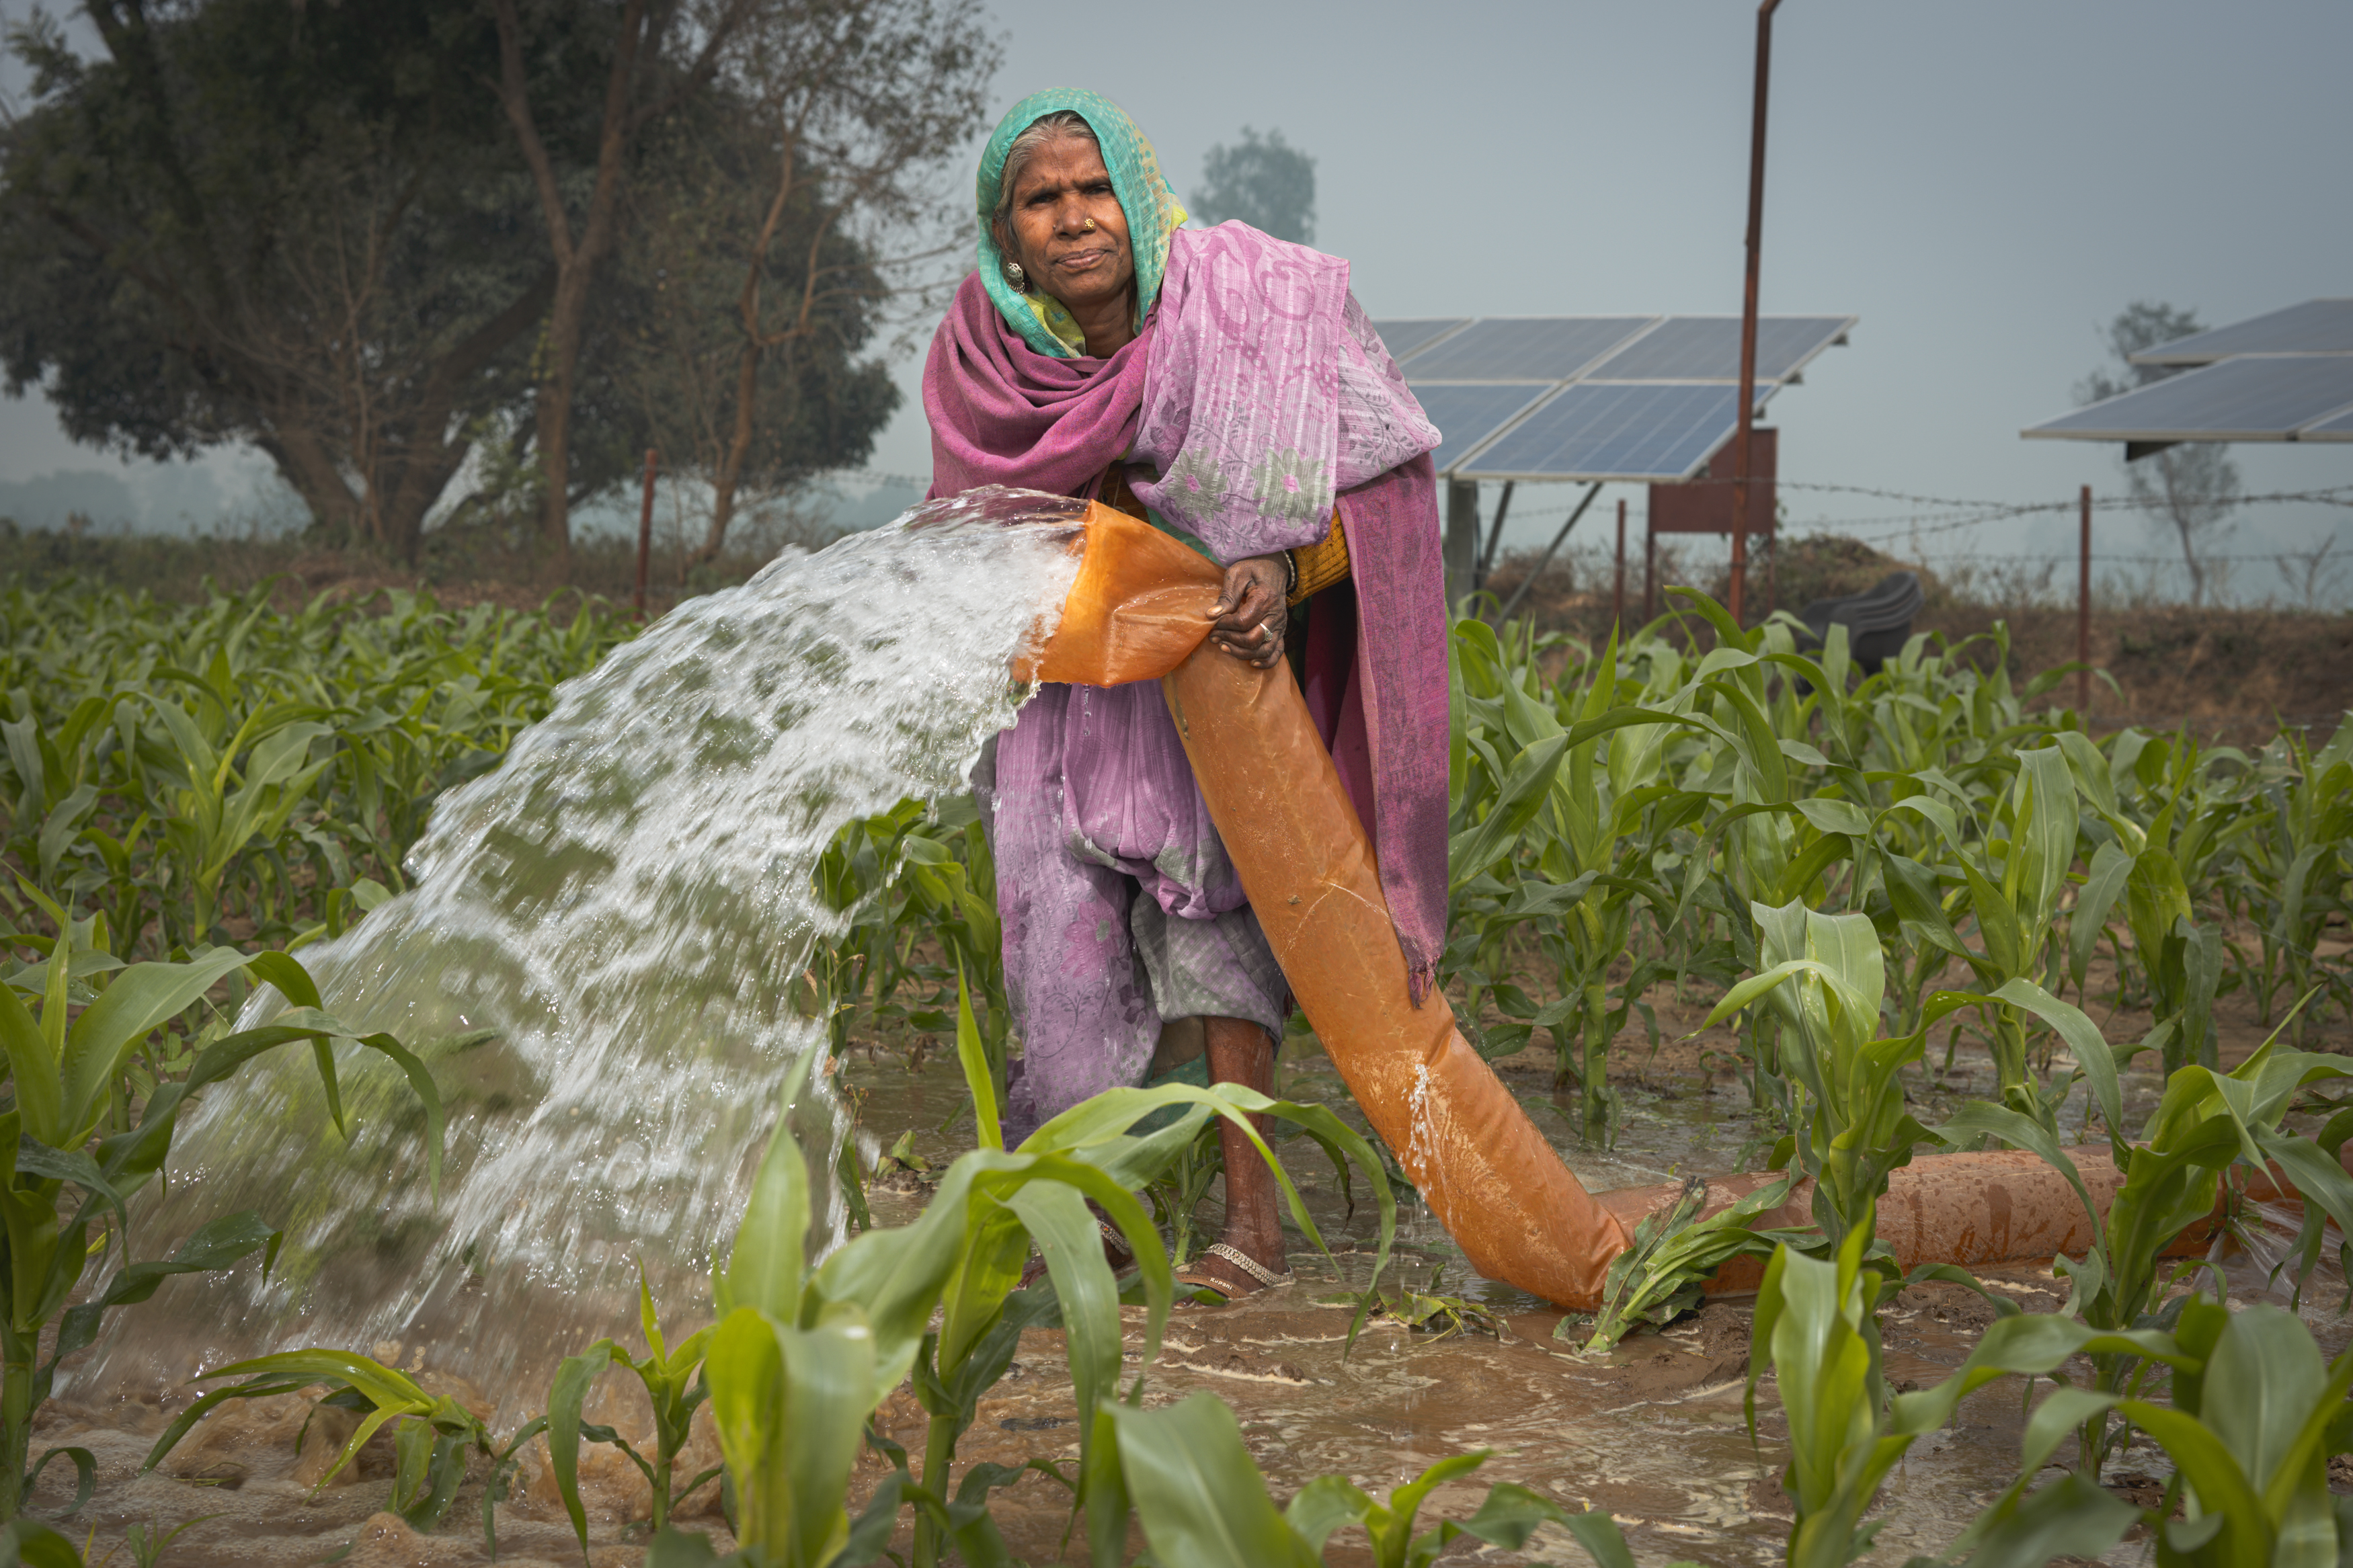
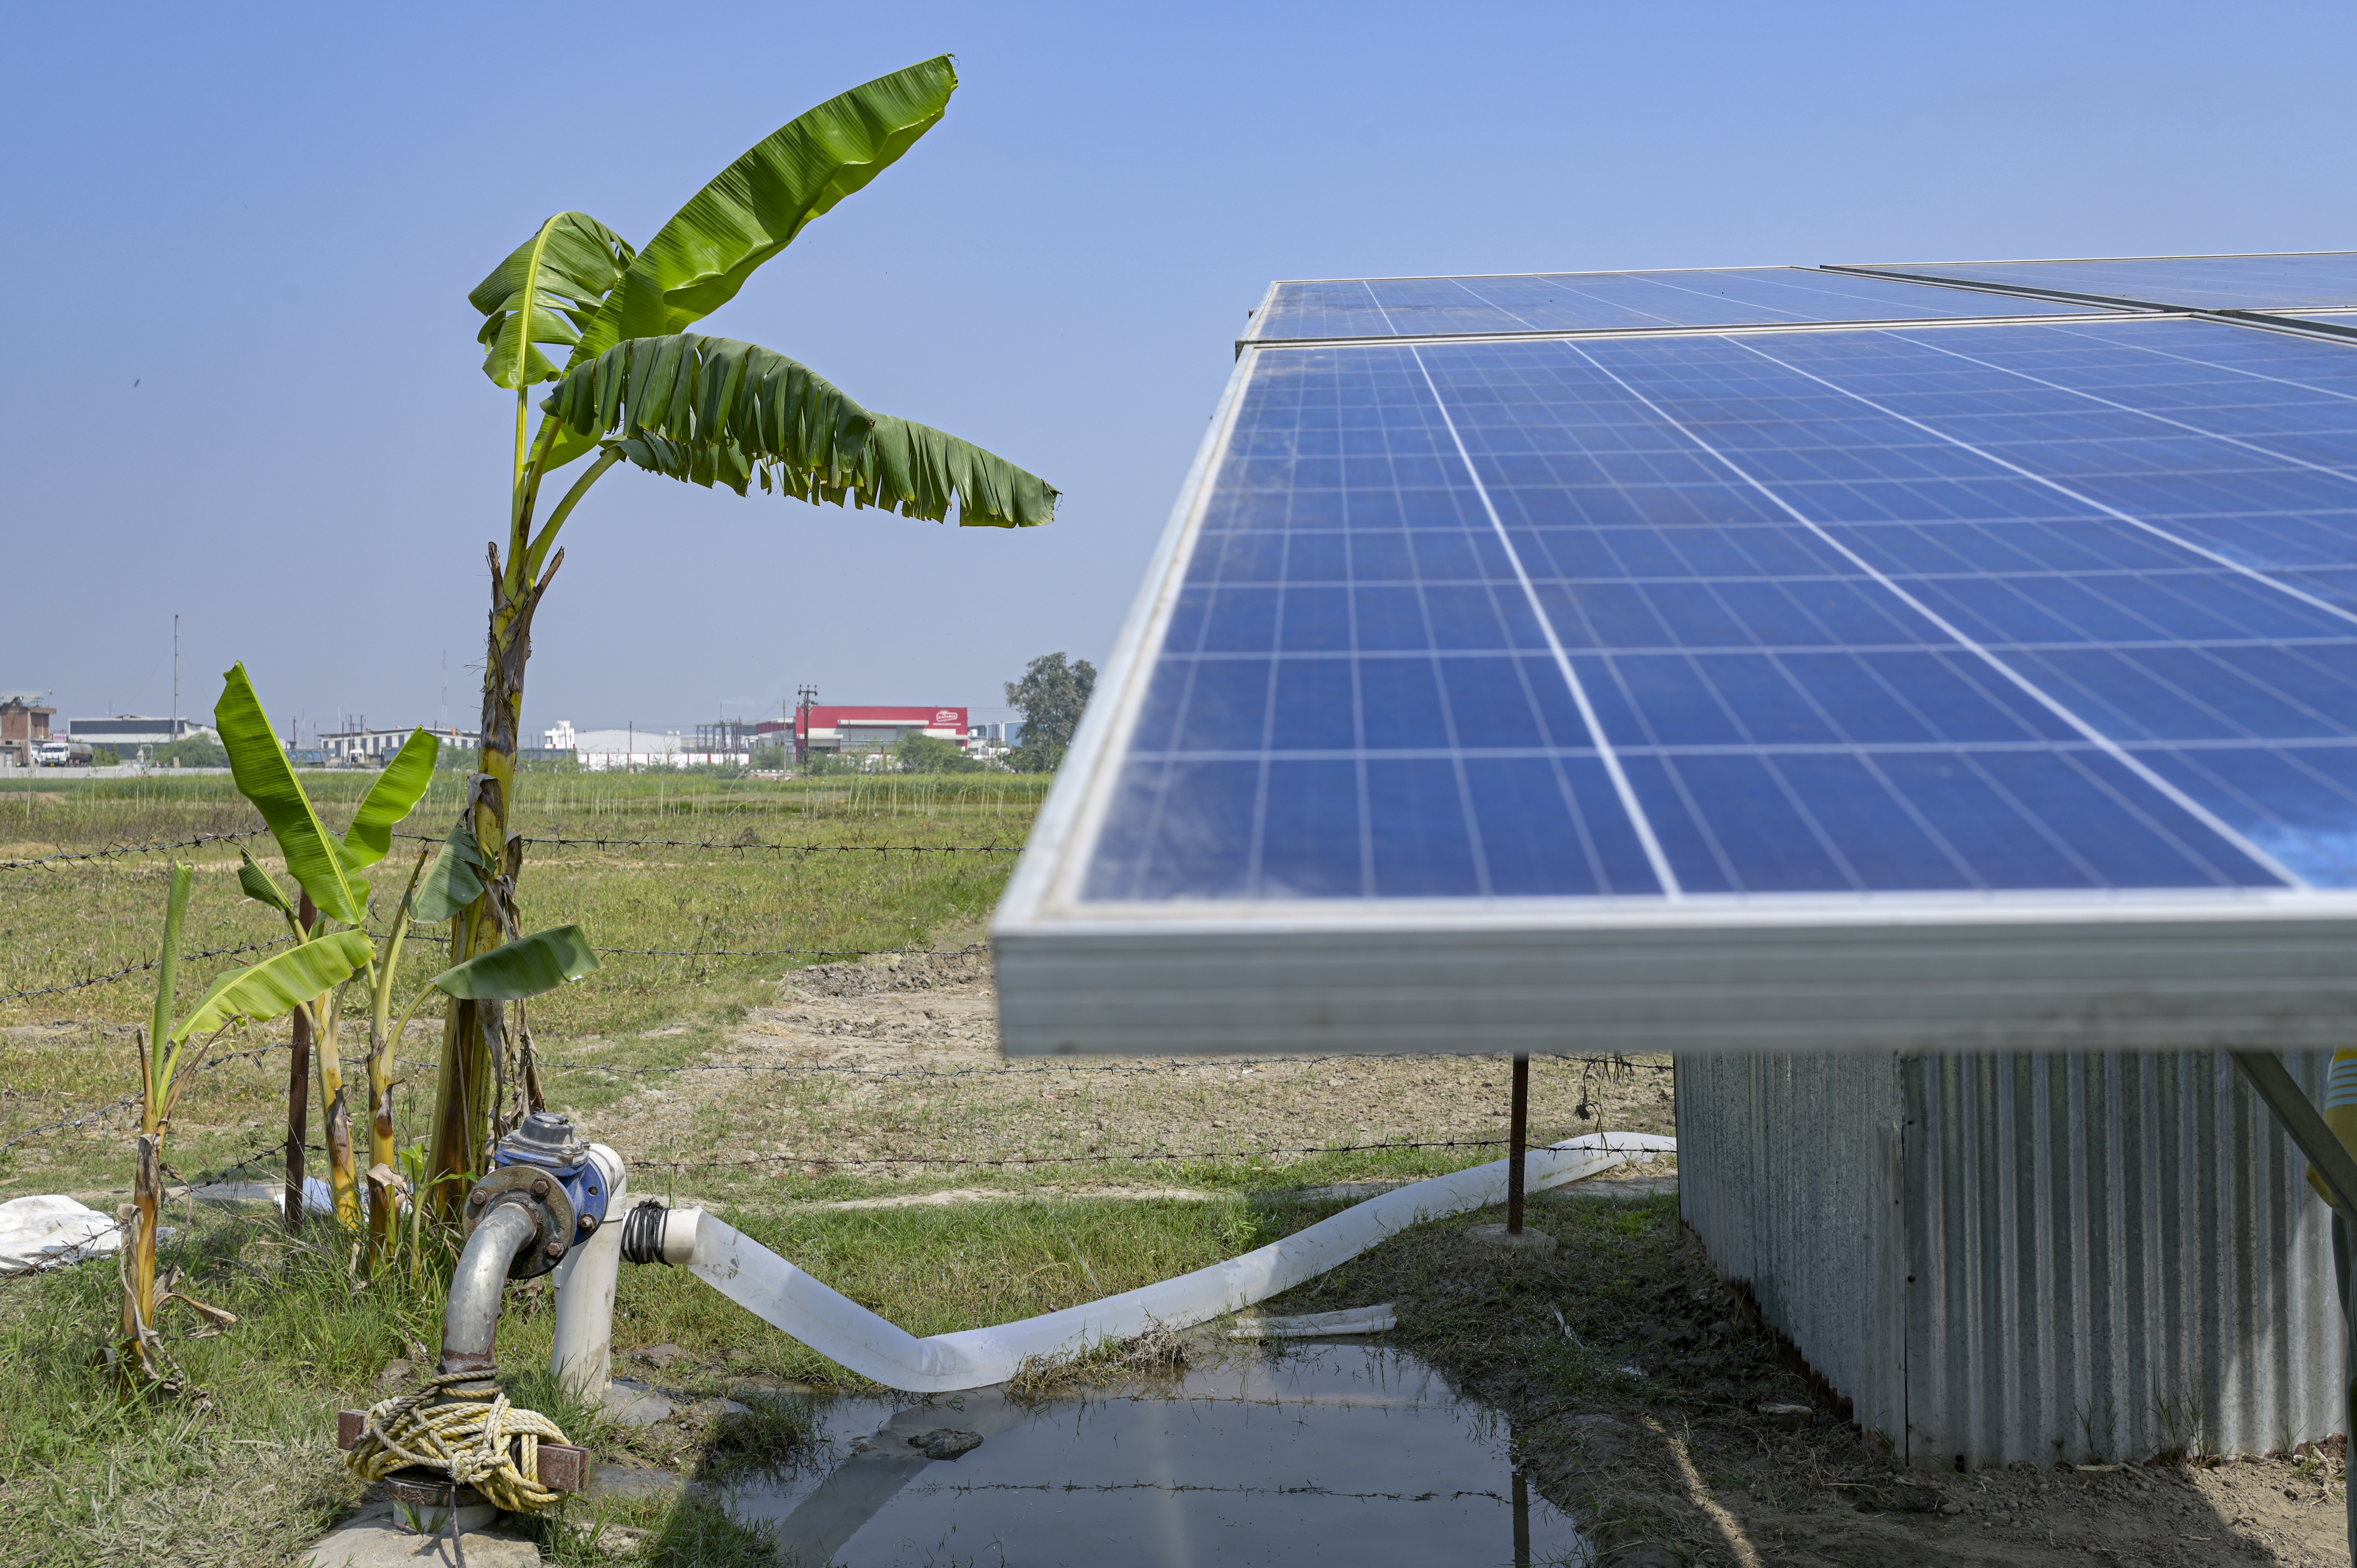
Oorja’s innovation lies in both its business and impact model. The company owns, operates, and maintains solar pumps on farms, encouraging farmers to swap unreliable diesel pumps with a more affordable and dependable solar irrigation service. Farmers only pay for the water they use, at a fixed tariff per cubic meter based on meter readings.
This removes unpredictable costs while providing reliable, low-carbon irrigation. As farmers irrigate regularly and produce high-quality crops, they increase yields and income. This allows them to reinvest in better seeds, fertiliser, and other farming inputs, and even grow new crops during different growing seasons.
“We make solar irrigation accessible through a community-based, pay-per-use model that smallholder farmers can actually afford”, explains Chief Business Officer (CBO), Audrey Fillon.
Pay-per-use operations model
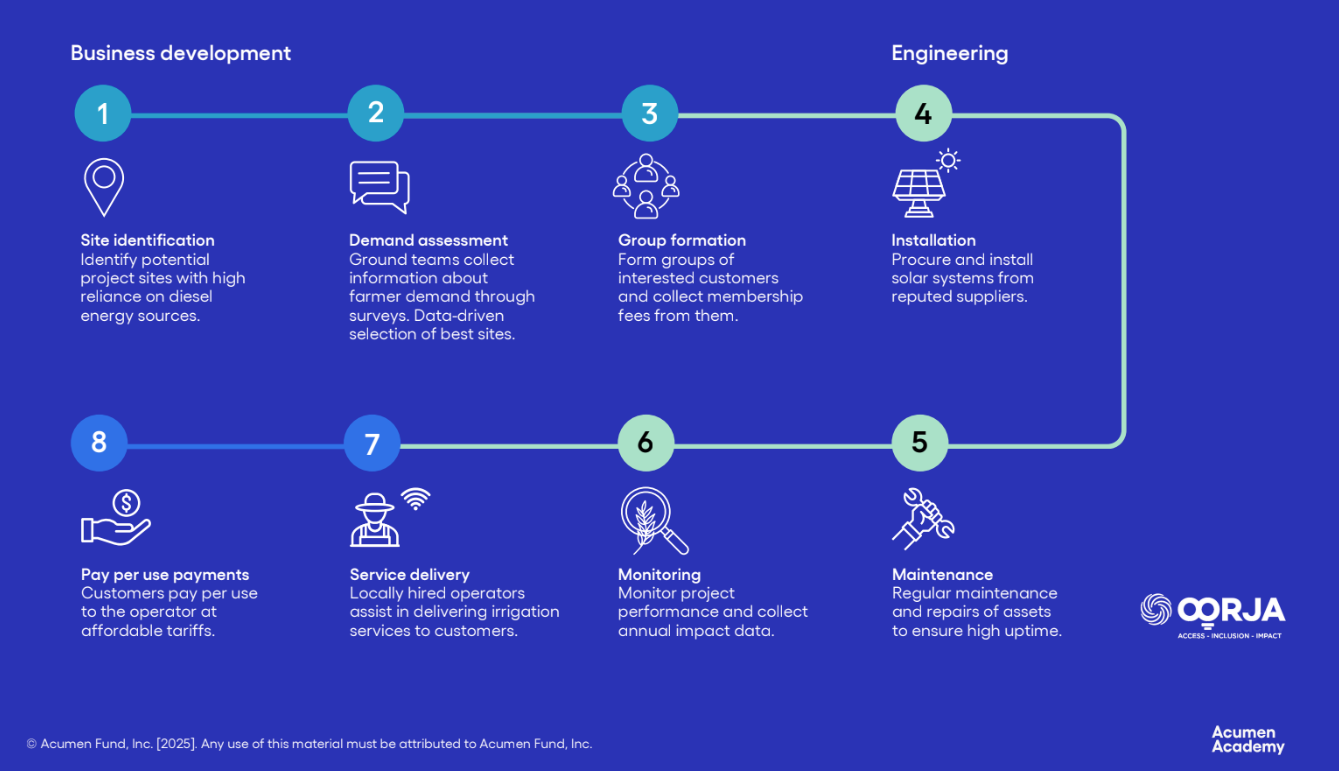
To establish each site, Oorja’s field teams work closely with farming communities to identify locations and form community groups of about 15 farmers. Each farmer contributes a small membership fee of about ₹1,000 to demonstrate commitment and cover setup costs.
Once a site is approved, Oorja installs the solar irrigation system and appoints one farmer from the group as a Pump Operator, creating a new green “last-mile”1 job. The operator manages day-to-day use, records water meter readings, and ensures fair access. They earn a share of revenues, creating local ownership and accountability.
By October 2025, Oorja operated around 273 solar irrigation pumps across six districts in Uttar Pradesh, serving roughly 4,000-4,100 farmers and reaching about 54,000 beneficiaries.
Each installation generates operational data on energy output, water use, and payments, which feeds into Oorja’s impact tracking and climate-smart advisory services.
1 Last-mile” refers to the final, local link between a service and the people who use it, in Oorja’s case, the farmer who operates the system on the ground.
Theory of Change
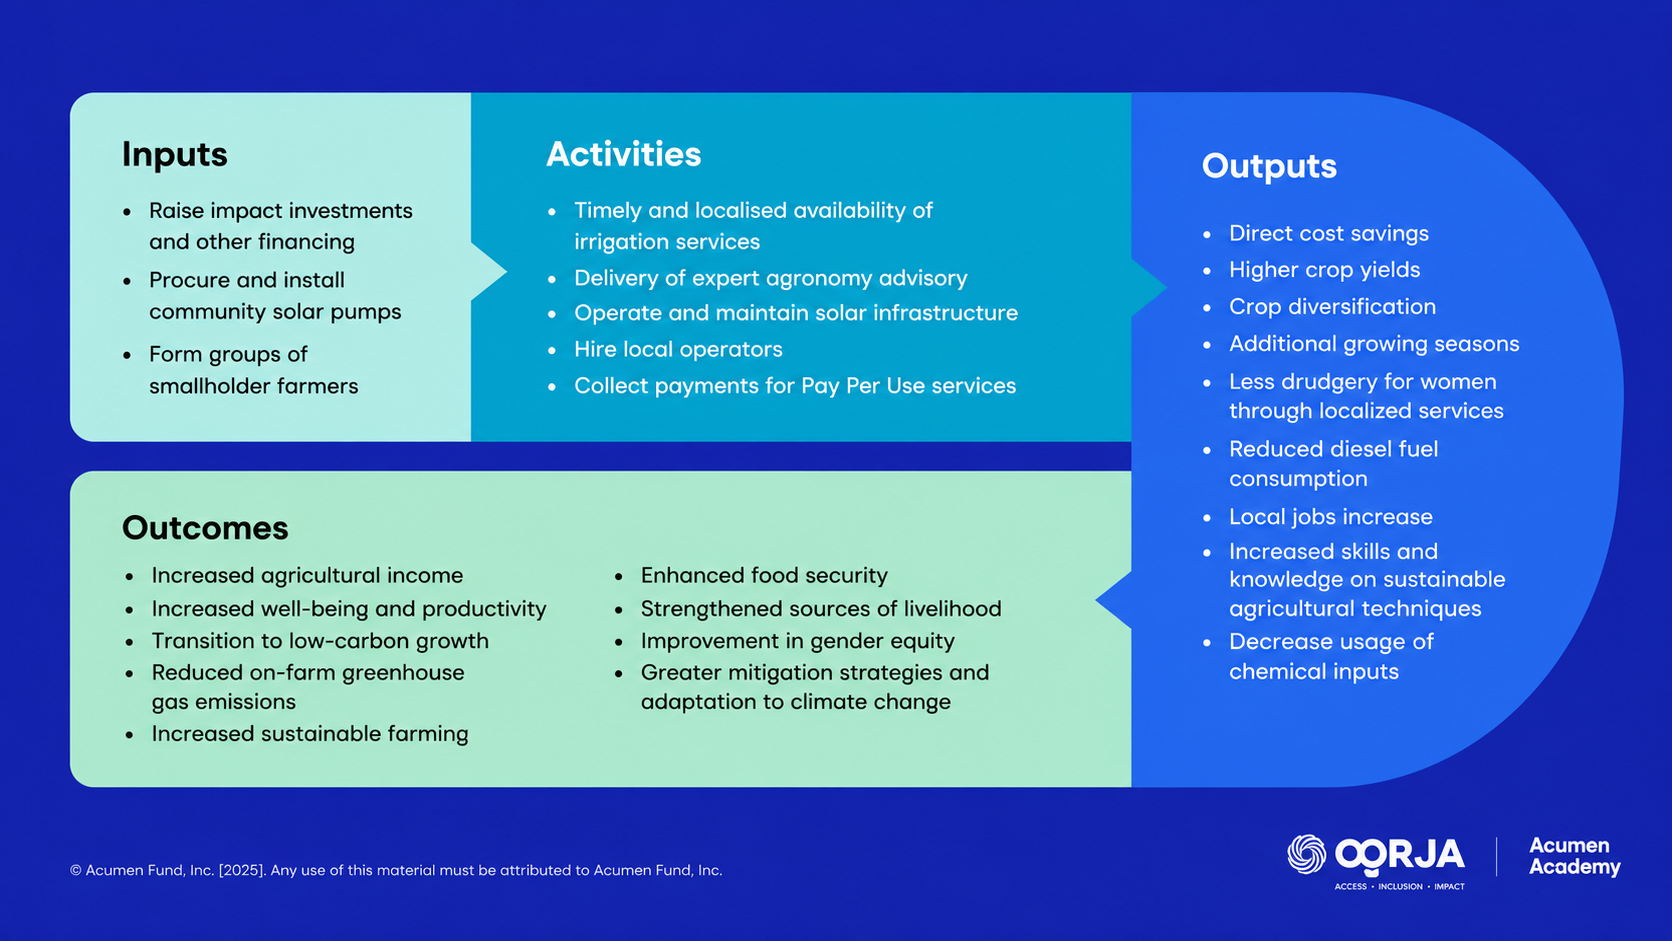
From the beginning, Oorja focused on making irrigation affordable, available, and reliable year-round. The improvements they saw in farmers’ lives enabled the team to track and measure their impact, alongside energy and operational metrics. Because they built a robust data collection process into their monitoring, they were able to map a long-term theory of change.
Oorja's impact framework
For Oorja, impact measurement is central to its mission. The framework blends rigorous data collection with human stories, offering a complete picture of how its services transform livelihoods while protecting the environment. It has evolved from tracking basic energy outputs to measuring meaningful change in people’s lives.
Oorja measures progress across three dimensions: social, economic, and environmental. Each dimension is represented by clear, trackable indicators. The pillars align with the UN Sustainable Development Goals (SDGs) and ensure that Oorja captures not only activities, but the tangible outcomes that matter most to farmers and the planet.
The three pillars of impact
How Oorja measures change
The team collects data at multiple intervals, from daily operational tracking to six-month internal assessments and independent impact evaluations every two to three years.
Oorja’s impact measurement begins long before a solar pump is installed. Before the projects are installed, the team conducts baseline studies to understand existing conditions, like how farmers live and work. These surveys record crops grown, diesel spending, yield patterns across the three farming seasons of Rabi, Zaid, and Kharif, and the challenges farmers face in a typical year.
Once a project is underway, Oorja returns to the field every two years to carry out midline studies to compare outcomes between farmers using Oorja’s services and similar farmers in nearby villages where Oorja’s systems are not installed. These comparisons help reveal how solar irrigation affects costs, productivity, and income. The team always includes women farmers in the sample to understand gender dynamics and participation. All impact data is gender-disaggregated, and the Gender Mainstreaming Plan2 is reviewed once every two years at a minimum.
Alongside internal research, Oorja partners with independent researchers to assess broader outcomes, including income growth, crop diversification, and the adoption of climate-smart farming practices. The team refines metrics annually to maintain their relevance.
“Finding the right metrics is not easy,” Audrey reflected. “They need to speak to our operational reality but also to investors and partners.”
While much of the data is quantitative, Oorja values the stories behind the numbers. Field teams collect testimonials, photos, and videos that document how access to clean energy affects the daily lives of farmers and their families. These stories add depth to the data and keep human experience at the centre of measurement. They also enable Oorja to identify meaningful metrics that may not have been measured in the past.
Oorja’s approach follows a steady rhythm of data collection that blends short-term tracking with long-term evaluation.
2 Gender Mainstreaming Plan: A framework that ensures gender considerations are integrated into all operations, decision-making, and impact measurement, rather than treated as an optional activity
Oorja's impact measurement cycle
# | Assessment | Purpose | Responsibility | Data Collection | Frequency | Audience |
|---|---|---|---|---|---|---|
1 | Impact assessment | Detailed assessment of Oonnati and Oorvar3 for a sample size | Impact Manager | Nov-Dec | Once in 2 years | Funders, investors, internal |
2 | Monthly impact tracker | Key impact indicators that can be calculated on a monthly basis | Impact Manager and Project Associate | Daily | Monthly | Funders, investors, internal |
3 | Annual groundwater reporting | Impact of solar pump on groundwater level, on a sample basis | Impact Manager and Project Associate | May-June | Annually | Funders, investors, internal |
4 | Gender mainstreaming | Gender inclusivity in operations | Impact Manager | Sept- March | Monthly (data collection) Biennial (framework review)4 | Funders, investors, internal |
5 | Customer testimonials | Qualitative data from customers in the form of case stories | Impact Manager and Oorvar team | March-April, June, Nov | End of every season | Funders, investors, internal |
3 Oonnati and Oorvar are two different programs run by Oorja.
4 Oorja collects gender-disaggregated data every month and reviews the Gender Mainstreaming Framework every two years.
Oorja treats data as part of everyday operations, not as a reporting task. This helped the team build a culture where insights move quickly between field teams and leadership.
Is your data helping people make timely decisions, or does it sit unused?
What habits or systems could ensure that information from the field regularly shapes your strategy?
How data drives decisions
At Oorja, data collection is part of everyday work. The company has built a culture of continuous learning where data flows seamlessly between field teams and the head office. Evidence informs decisions at every level, from field operations to strategic planning.
Collecting data in the field
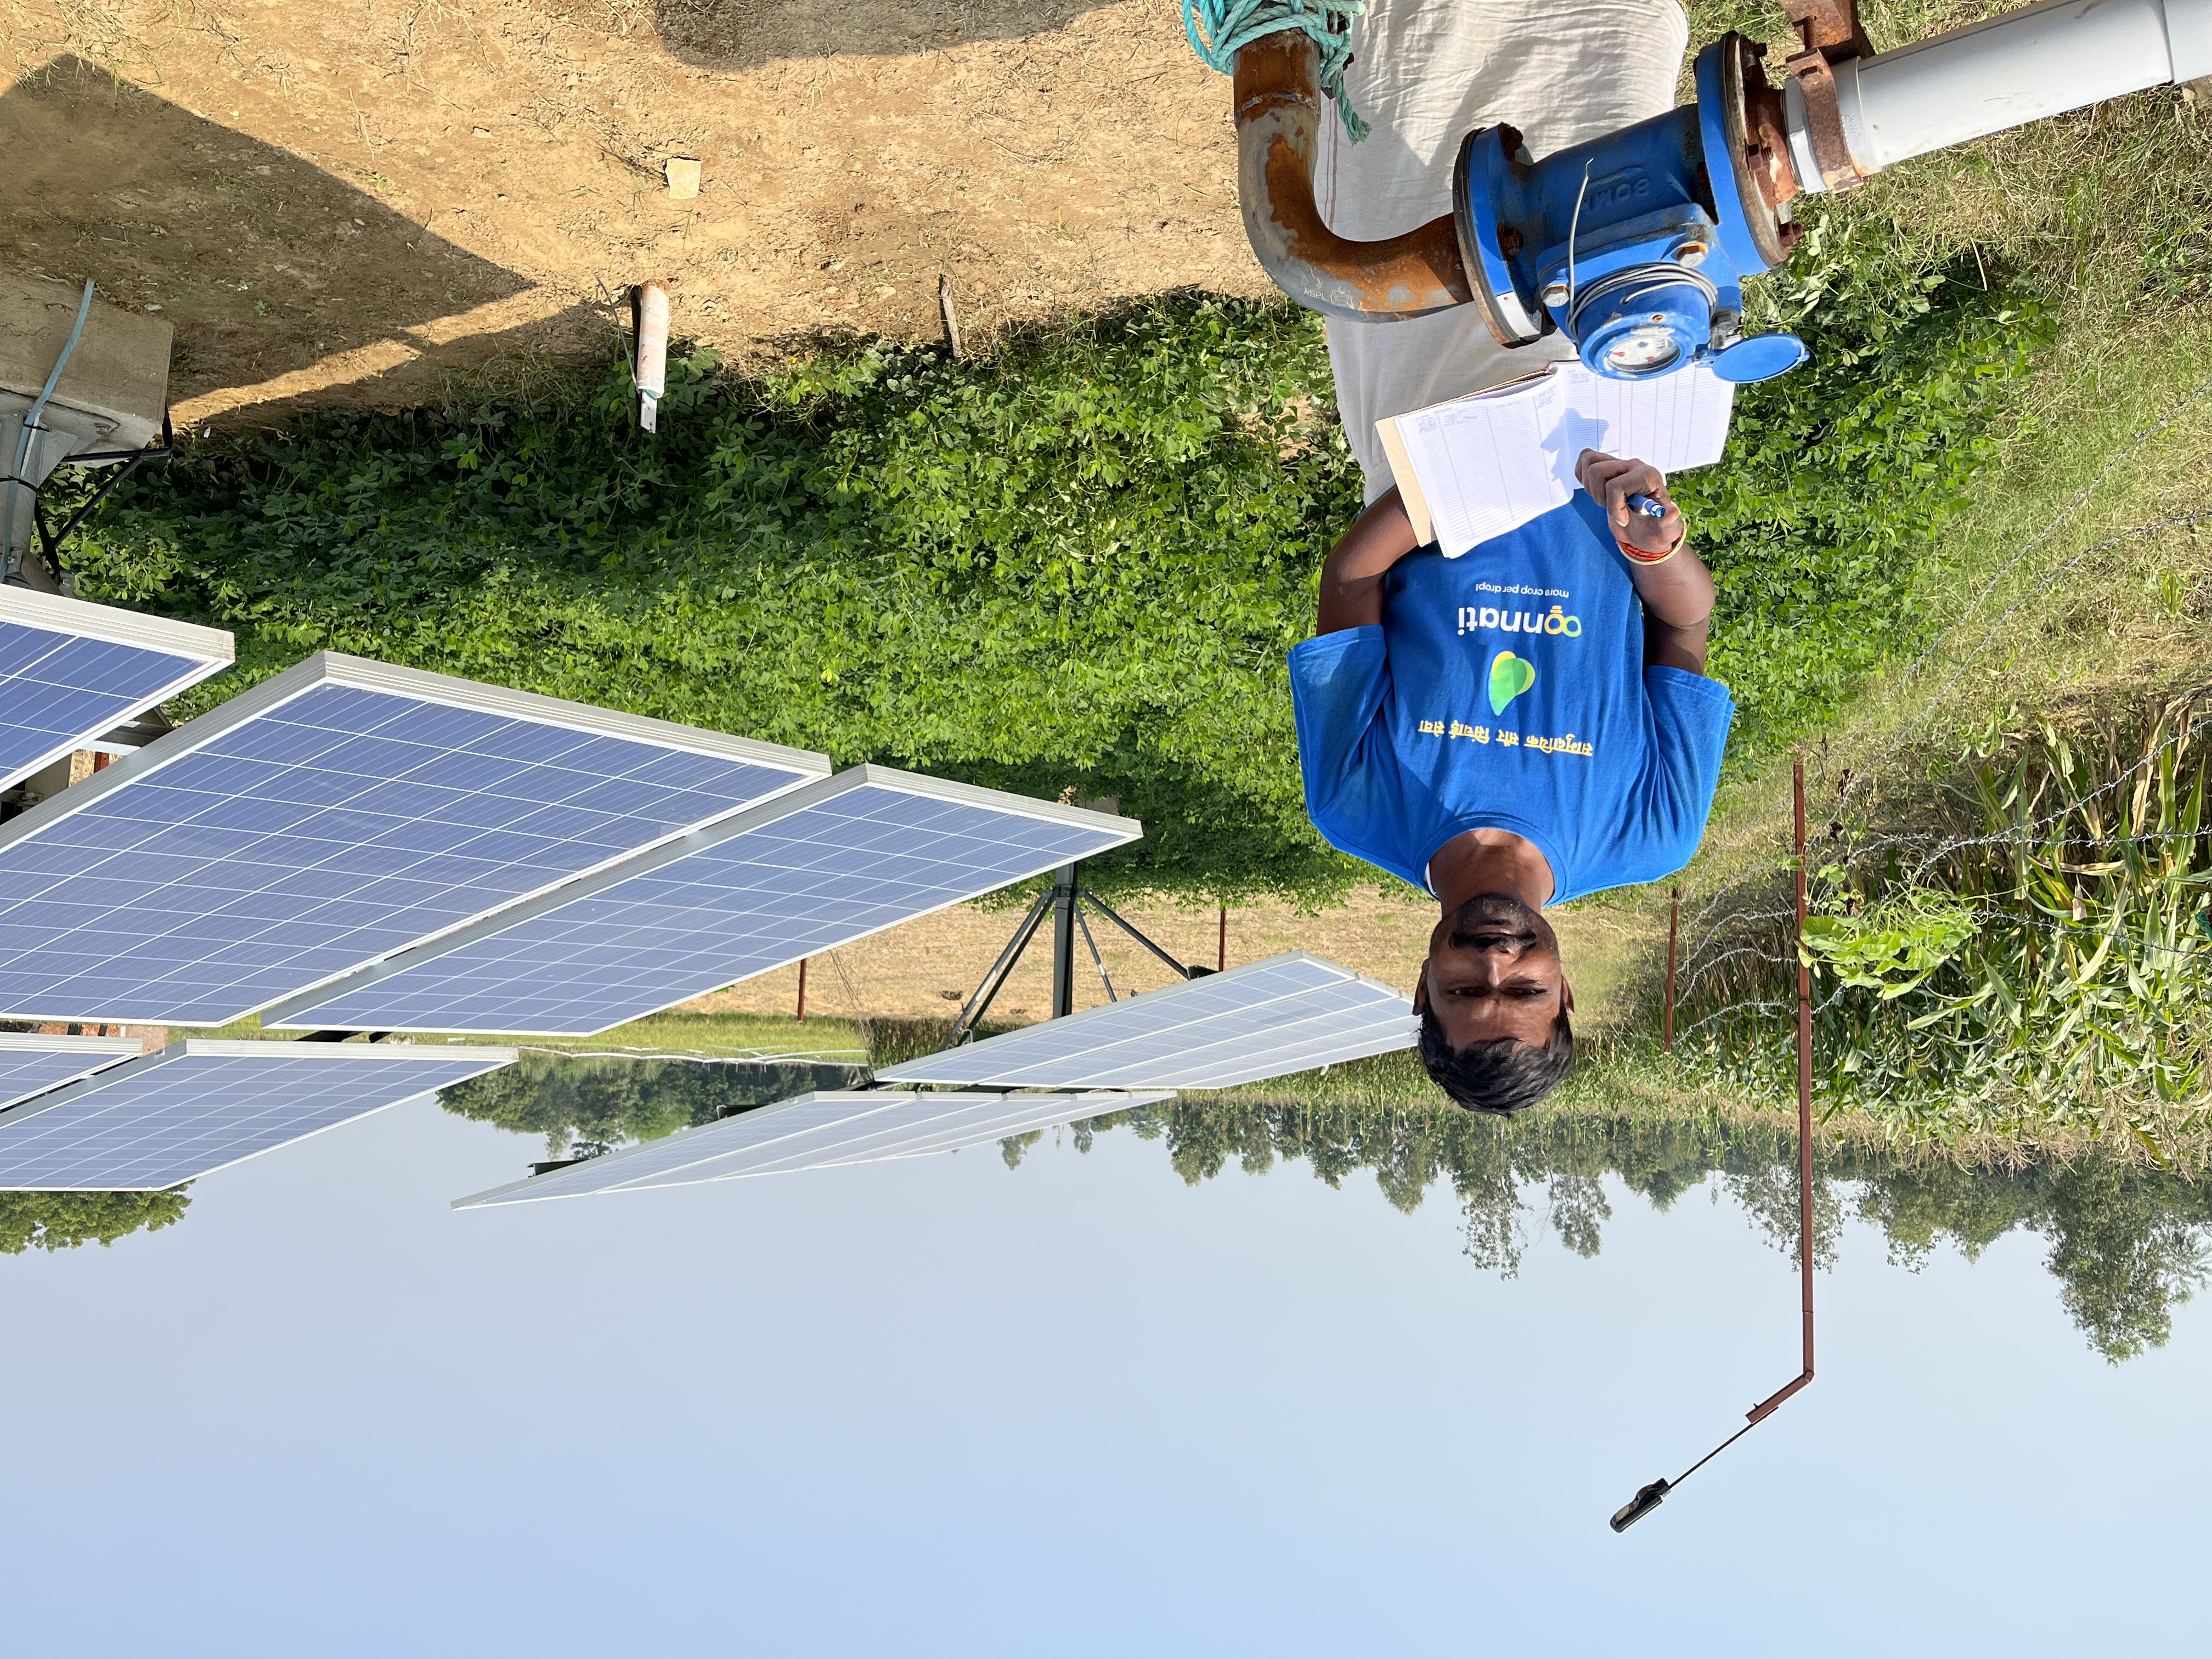
Each month, Pump Operators record daily water usage, customer information, and pump activity in logbooks and digital forms.
“All our data comes from primary collection,” explained Hridya, a Senior Project Associate on the Impact Measurement team. “Operators maintain the logbook for all customer information, like the amount of water they have used, and that information is recorded in our tracker.”
These records are uploaded to Oorja’s data collection platform, analysed, and visualised through impact dashboards. The dashboards track key metrics such as carbon emissions avoided, liters of diesel saved, cost savings, and active users, providing near real-time visibility across sites.
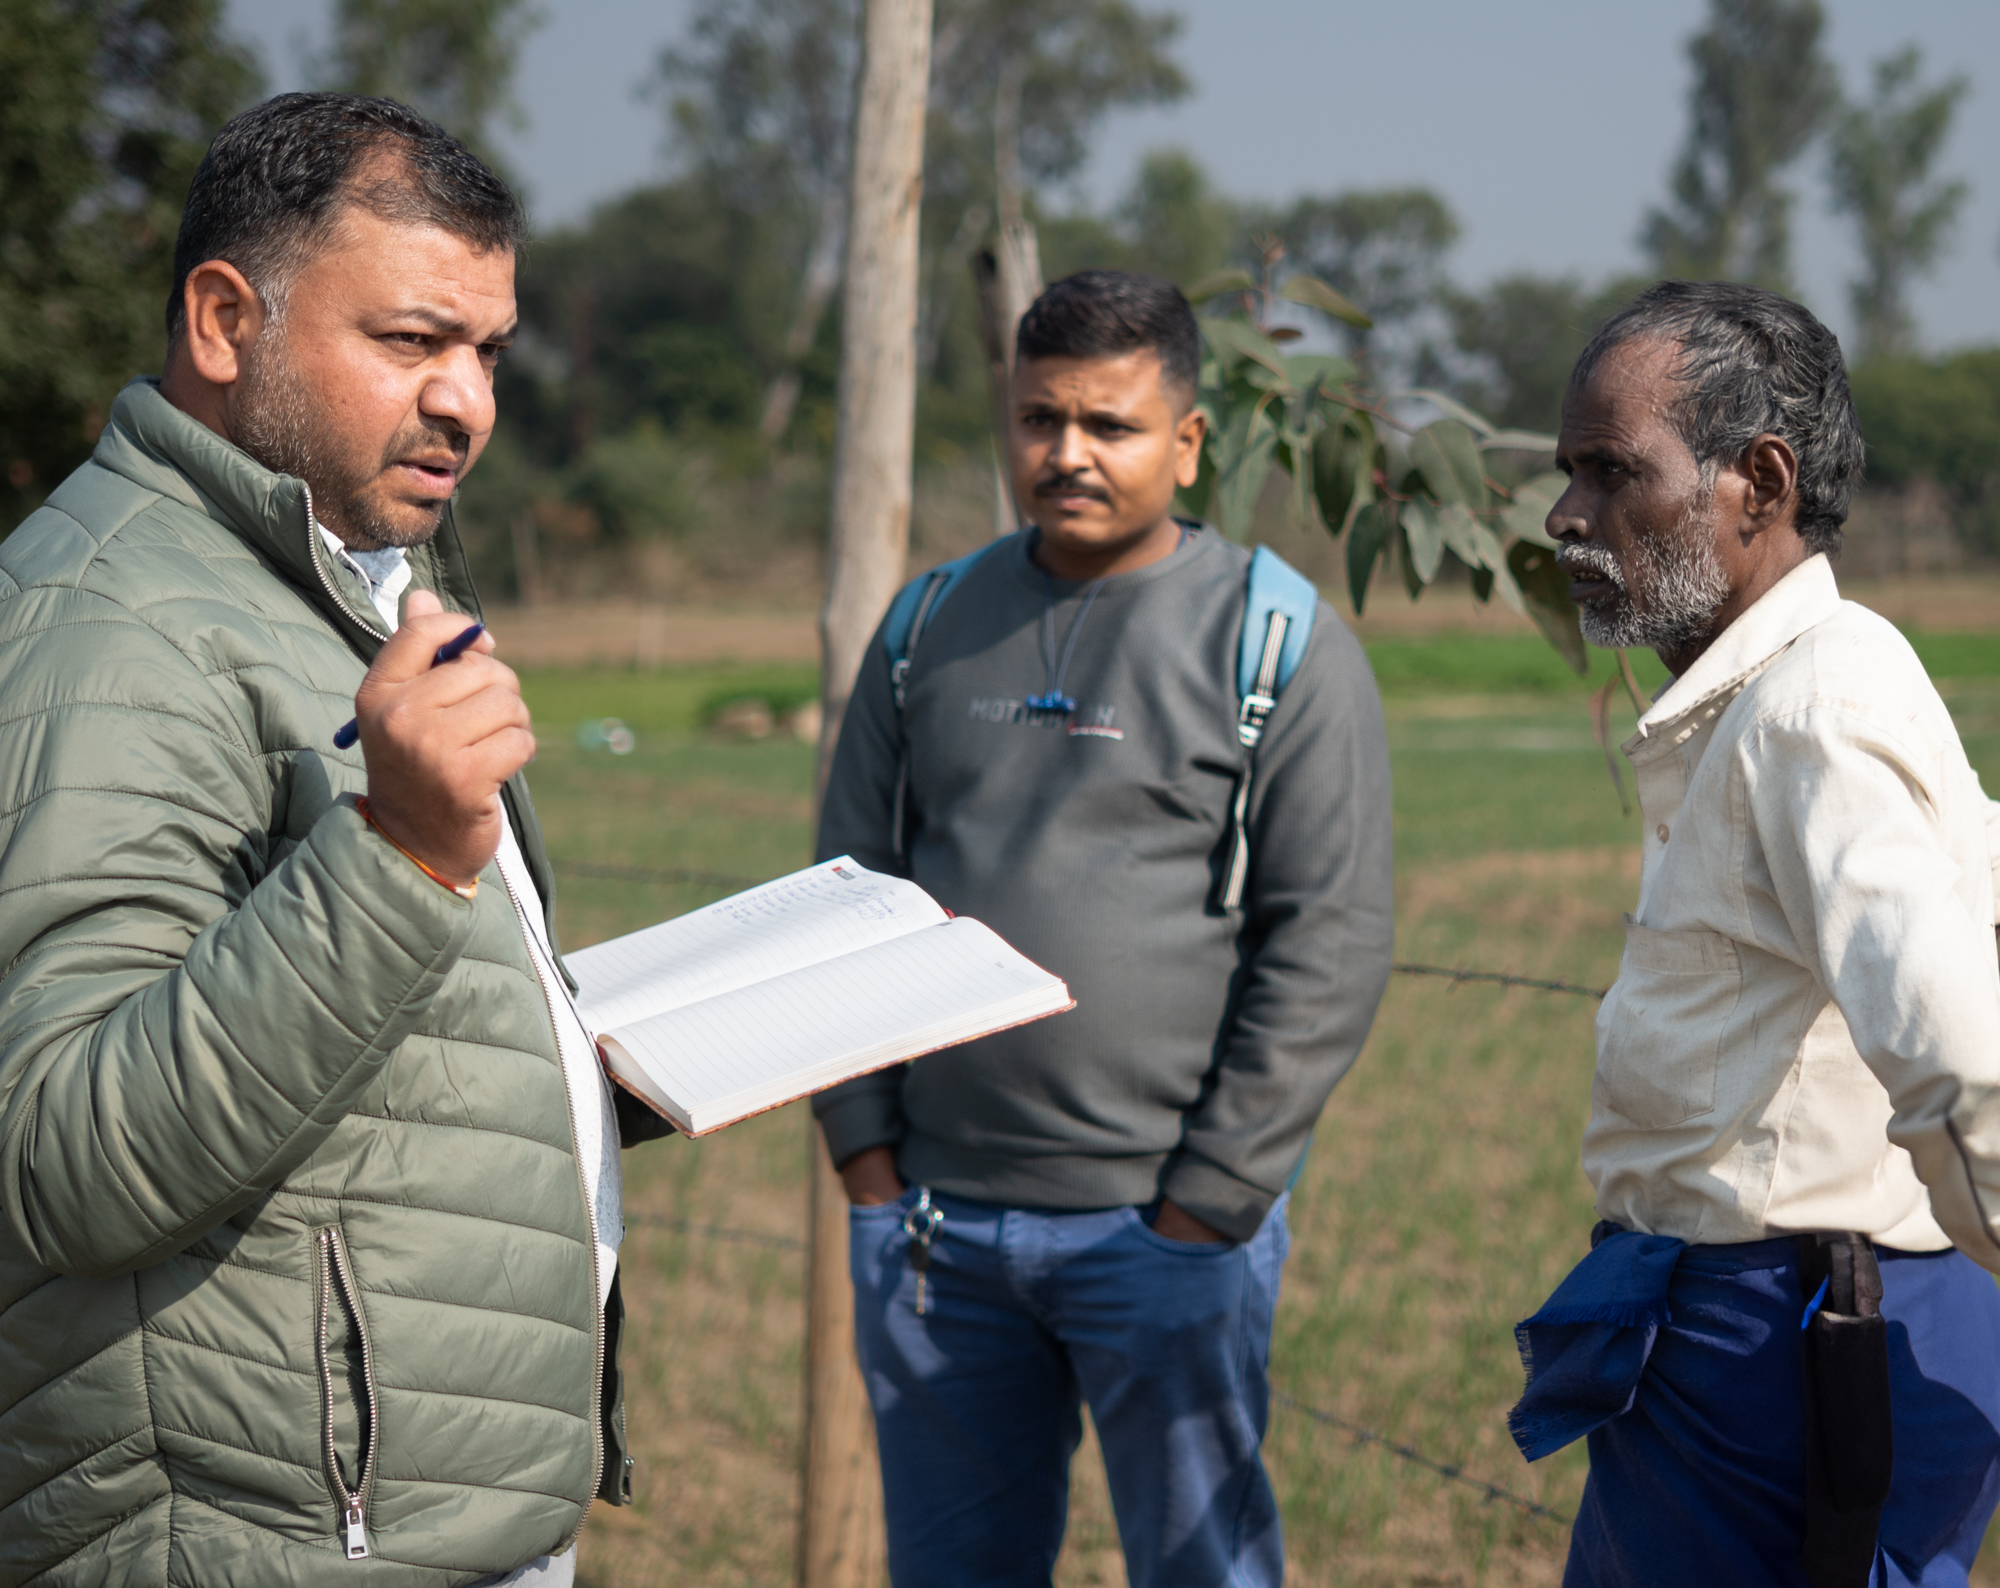
Farmer advisory and customer success teams collect most of this data during regular visits and training sessions, minimizing duplication and keeping farmer interactions meaningful.
“Their job is to speak to farmers all the time,” Audrey noted. “They deliver training, collect feedback, and make sure operators are engaged.”
Ensuring insights flow both ways
Data flows both top-down and bottom-up. Pump operators and farmer advisory teams log water use, farmer feedback, and on-ground issues, while head office teams analyze this data to identify trends and set priorities. This two-way exchange ensures that high-level strategies are grounded in field realities and operational staff understand the impact of their work.
Responding quickly using data
Monthly dashboard reviews anchor decision-making. If pump use drops, the team looks for month-on-month, quarter-on-quarter, and even year-on-year trends in the data to understand what is driving the change.
“If the average is still low, we investigate,” Audrey said. “Is the operator disengaged? Was there high rainfall? Did advisory fail to transition farmers to a new crop? We go step by step until we find the cause.”
This ensures decisions are evidence-based at every level. Data triggers targeted investigation and action, such as retraining operators, revising irrigation schedules or piloting new solutions like solar fencing.
By embedding data into its operational DNA, Oorja transforms measurement from a reporting obligation into a driver of innovation, accountability, and continuous improvement.
Improving business plans
Beyond day-to-day troubleshooting, the same dashboards help leadership understand structural shifts in the business. Instead of reacting to short-term dips, the focus is on year-on-year and seasonal patterns in pump use, customer activity, and revenue. When a change persists, they test assumptions against rainfall, operator engagement, crop cycles, and farmer behaviour to see what’s really driving it. These deeper reviews inform decisions such as refining advisory support, adjusting pricing, adding services, or planning new pilots. In short, data doesn’t just guide operations – it shapes how the business evolves.
Testing new products
Oorja pilots new products by using data gathered from research and surveys. They run small pilots, evaluate results, and decide whether to stop or scale based on measurable outcomes.
One example is the price elasticity pilot. This pilot aimed to align Oorja services with the needs of a price-sensitive market by offering different tariffs in multiple geographical areas. Field data showed that some farmers used the service only partially, which limited their potential income gains. Oorja then co-designed a research study with IWMI and SPEF to measure the increase in demand that follows a reduction in price. By building measurement into testing, Oorja uses data to drive operational discipline, learning, and innovation.
Challenges and lessons learned
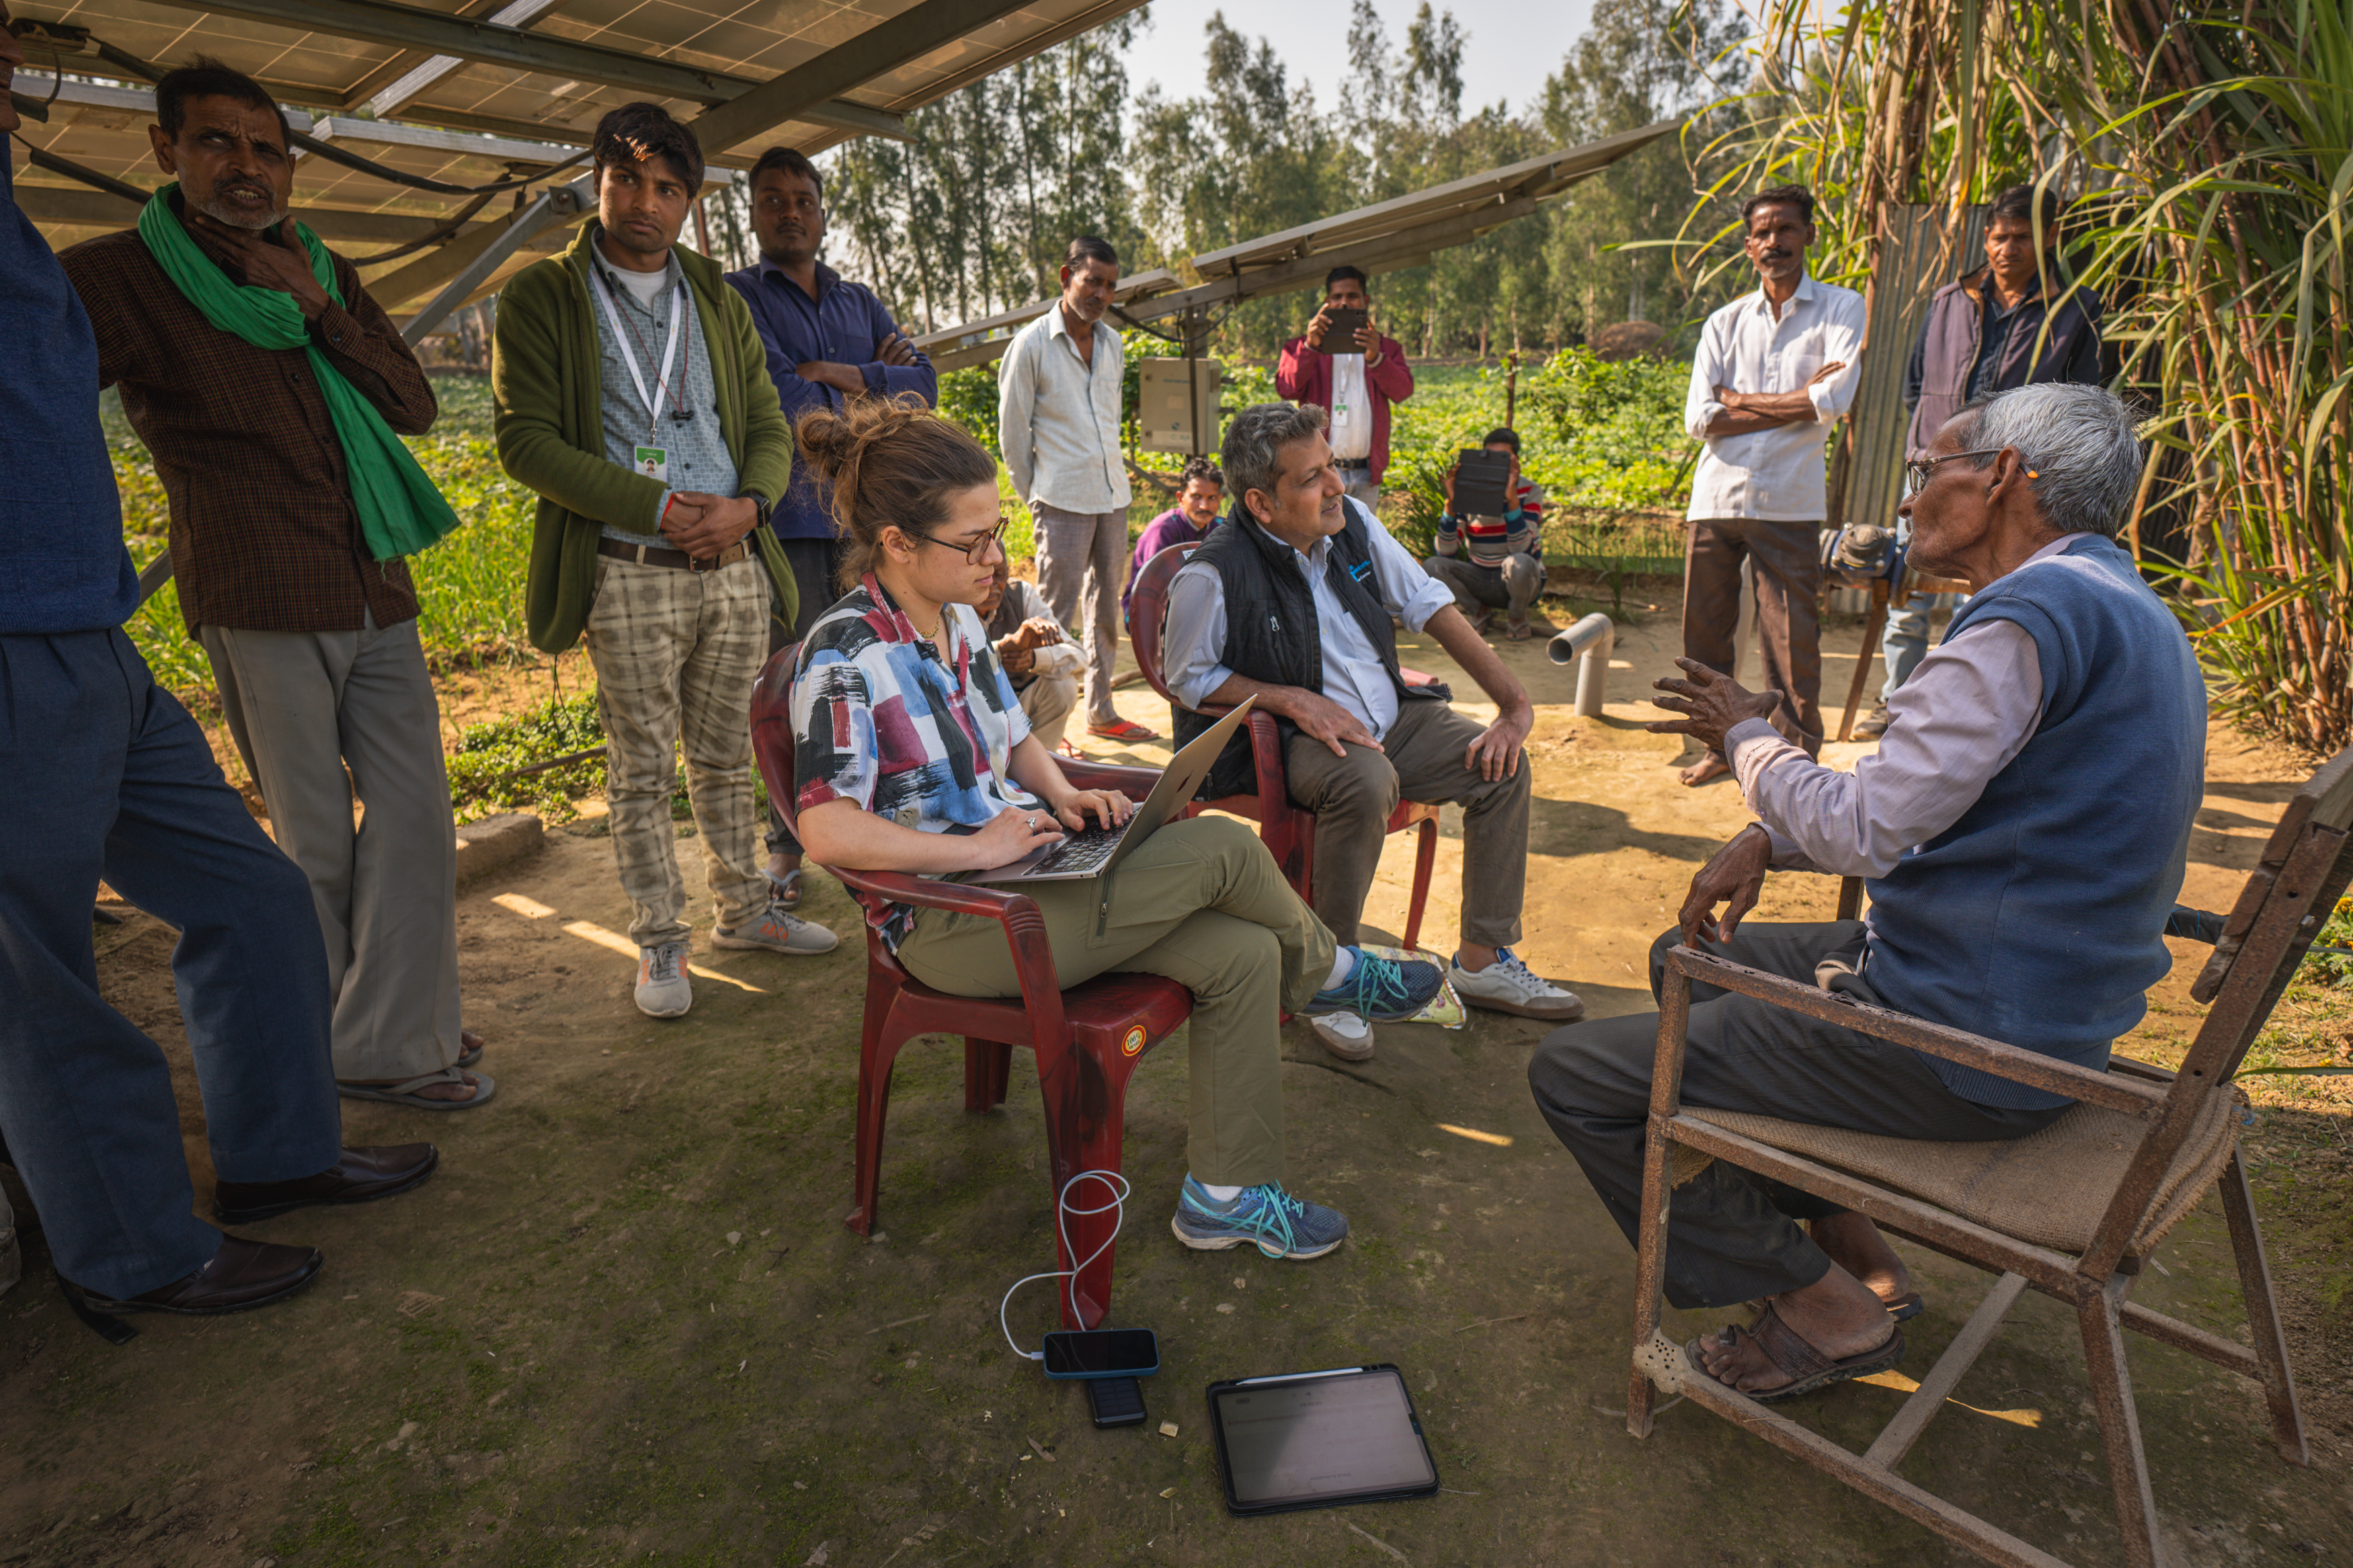
Embedding data collection within operations has not been simple. Oorja has learned several lessons along the way.
Reliability of self-reported data
Early on, Oorja struggled with the accuracy of self-reported information from farmers. Since most farmers didn’t keep formal records, their income and yield figures were often rough estimates, leading to inaccuracies that were difficult to verify.
To improve accuracy, the Oorja team broke questions into crop-specific details such as yields, quantities sold, and sales values, and cross-checked responses against operational data. These practical steps have improved data accuracy and reliability without burdening farmers with more data collection.
Respondent fatigue
‘Respondent fatigue’ happens when farmers are repeatedly asked to complete long surveys. Each can take one to two hours and involve answering similar questions, sometimes across several visits. It helps generate robust data, but can become burdensome for farmers.
To reduce fatigue, Oorja streamlined and integrated data collection within existing interactions to minimise duplication while maintaining data quality.
Evolving assumptions
Real-world experience has challenged Oorja’s theory of change, leading to improvements and refinements. For example, the team assumed that crop diversification would directly lead to higher farmer incomes. However, field data revealed that it involved multiple factors, including market access, seasonal variations, and whether crops are grown for sale or household use.
To test and refine their assumptions, Oorja adopted a more nuanced, evidence-based approach to program design by integrating continuous learning cycles rather than relying on static assumptions.
Oorja learned that even well-intentioned data collection can become burdensome for the very people they aim to serve. Streamlining processes protected data quality while respecting farmers’ time and attention.
Are you asking your community for more information than you actually need?
How might you simplify data collection so you gather essential insights without creating fatigue or frustration?
Advice for social entrepreneurs
Data collection and impact measurement have been central to Oorja’s journey from the very beginning, even though its approach has evolved.
As Hridya reflects, “If we were starting over with what we know now, we would have a clear impact tracking sheet in place, with data gathered across defined metrics that help us show progress against multiple SDGs. A more structured approach from the outset would have strengthened the link between data insights and strategic decisions."
Dr. Clémentine, Oorja’s co-founder, adds that this evolution has been as much about focus as process.
“In retrospect, we've learned what's easier to measure and what's harder to measure. We’ve also had to check on what we really care about.”
The team now understands that impact data is not about quantity or complexity, but clarity and alignment – measuring what truly reflects the outcomes they seek to achieve. The team believes that better integration between data collection phases and streamlined processes will save time and resources while improving the quality of insights.
For social entrepreneurs in the early stages of their impact measurement journey, Clémentine’s advice is straightforward: “Keep it simple.” Build a robust yet manageable framework that challenges assumptions, defines metrics thoughtfully, yet remains practical to use.
“Don’t try to measure everything. Focus on what matters most, especially metrics that connect directly to your business growth and core mission.”
The Oorja team emphasizes the value of collaboration. External partnerships have helped Oorja generate high-quality, research-grade data. Working with research partners not only strengthens data credibility, it can also reduce internal burden and open access to insights and resources that help you grow smarter. These lessons continue to guide Oorja’s path toward deeper, more meaningful impact.
Impact in numbers
As of October 2025, Oorja’s impact looked like this:
Social: 54,000+ people reached across Uttar Pradesh (18% women); 3,200+ farmers trained ; 187 “green jobs” created for local Pump Operators.
Economic: 36% of farmers reported lower cultivation costs; 31% saw higher crop yields; 21% began growing a third crop; 93% reported higher income, USD 113,225 saved in expenditure.
Environmental: 72% reduction in diesel use; 49% drop in chemical inputs; 3,800 MWh of clean energy generated; 5,300 tonnes of CO₂ emissions avoided, 237,036 liters of diesel avoided.
Key takeaways
Build an impact model you can learn from. Start with clear metrics, then refine and focus them as evidence reveals what truly matters for your outcomes and business.
Embed data in daily work. Make measurement part of routine operations so information stays consistent, timely, and useful.
Let evidence update your assumptions. Use real patterns from the field to refine your theory of change and adjust services as needed.
Use data to steer decisions. Apply insights to operational fixes, new product pilots, and long-term planning so measurement improves both impact and performance.